Zabbix
- Configure Zabbix Docker
- Install Zabbix Agent Ubuntu
- Zammad Monitoring with Zabbix
- Docker Container Monitoring With Zabbix
- Truenas Monitoring with Zabbix
- Exclude Windows Services from Autodiscover in Zabbix 6.4
Configure Zabbix Docker
Configure Zabbix Server to point to zabbix-agent container
Figure 1
-
Clear 127.0.0.1 from IP address field
-
Enter zabbix-agent in the DNS name field
-
Set Connect to field to DNS
-
Click the Update button (Figure 2)
Figure 2

Configure Zabbix Server Timezone
Edit /opt/zabbix-docker/.env_web uncomment the following line:
#PHP_TZ=Europe/Riga
PHP_TZ=America/New_York
Configure Zabbix Server Server Name
Edit /opt/zabbix-docker/.env_web and set the following line:
ZBX_SERVER_NAME=Composed installation
to a server name that you like (Example: ZBX_*SERVER_*NAME=Widgets, Inc)
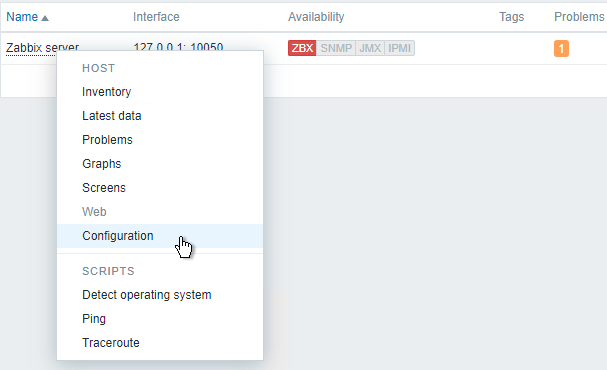
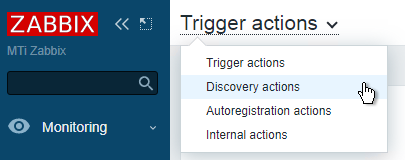
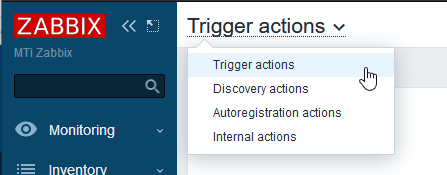
Configure Zabbix Auto Discover
Figure 3
-
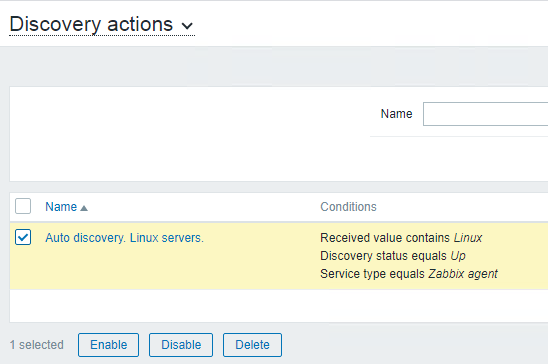
Select Auto discovery. Linux servers and click Enable (Figure 4) to enable Linux hosts auto discovery
Figure 4
Enable Zabbix Notifications
Figure 5
-
Ensure you have already configured notifications under Administration --> Media types.
-
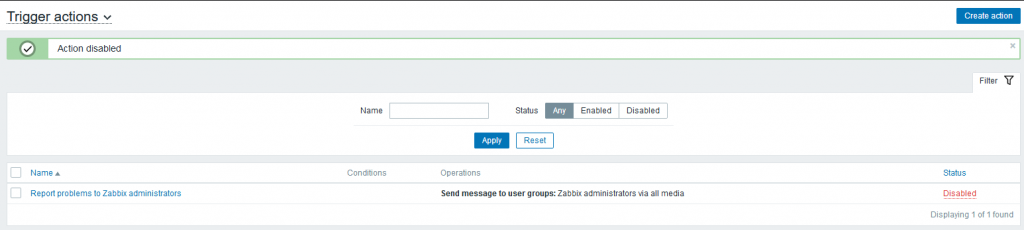
Click the Disabled link under the Status column in the Report problems to Zabbix administrators item in order to change the status to Enabled (Figure 6).
Figure 6
Enable Zabbix FreeNAS Monitoring
-
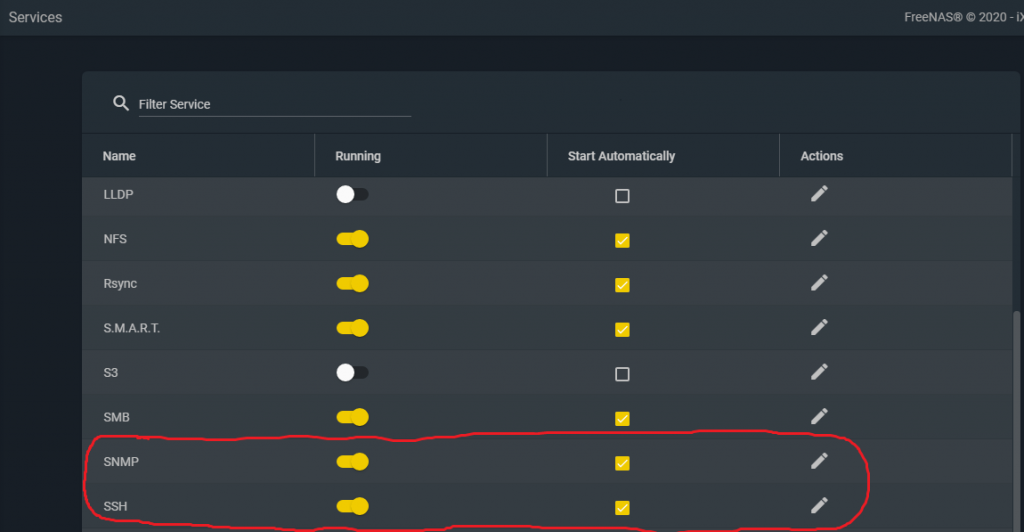
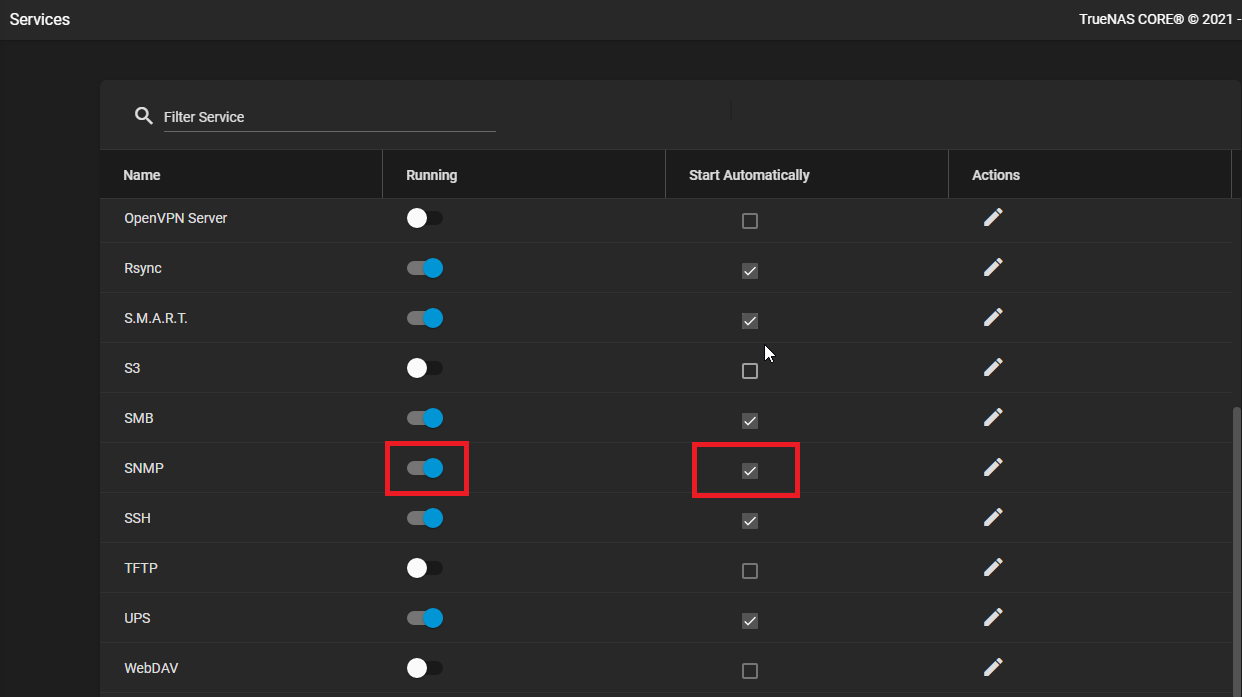
On FreeNAS server enable SNMP by going to Services --> SNMP and set it to Running and Start Automatically and enable SSH by going to Services --> SSH and set it to Running and Start Automatically (Figure 7).
Figure 7
-
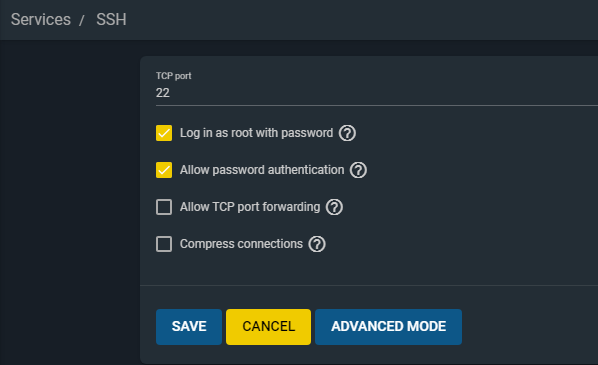
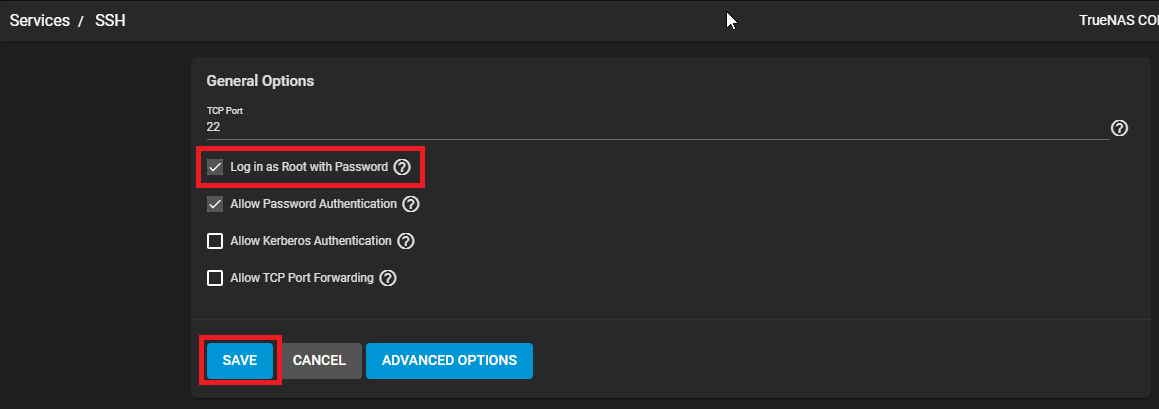
On FreeNAS server, under Services, click on SSH --> Actions and ensure Log in as root with password and Allow password authentication checkboxes are checked and click the Save button (Figure 8).
Figure 8
-
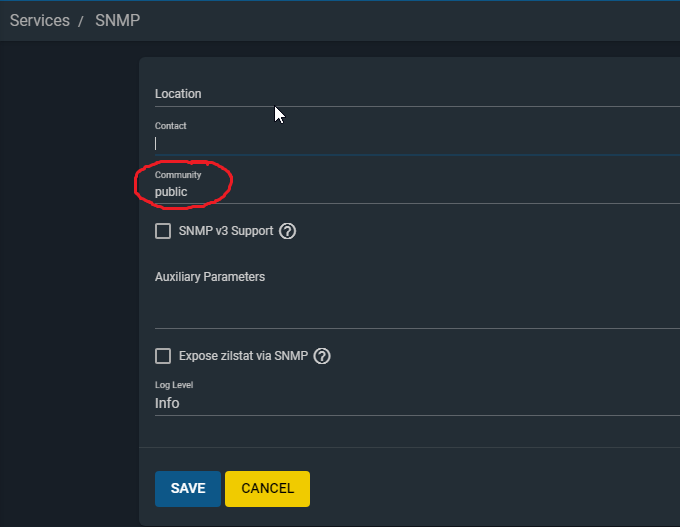
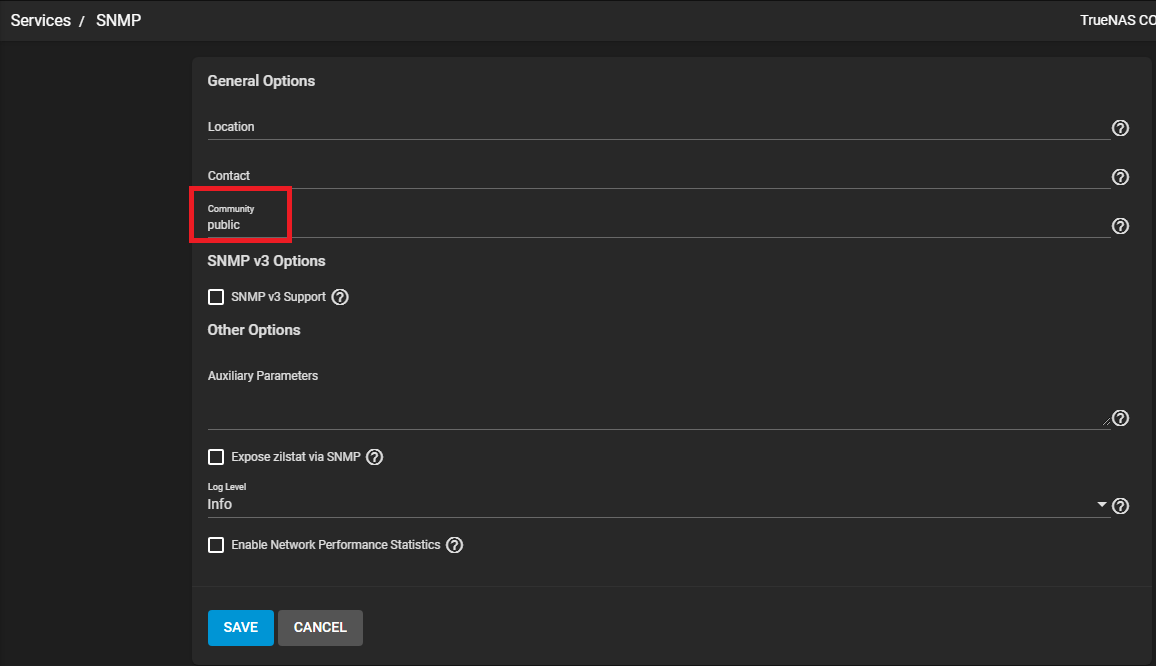
On FreeNAS server, under Services, click on SNMP --> Actions and note the Community string (default is public) or change as required and optionally set the Log Level to Info if you wish to get more information out of FreeNAS and click the Save button (Figure 9).
Figure 9
-
Using WinSCP or scp download the following file from the FreeNAS server:
/usr/local/share/snmp/mibs/FREENAS-MIB.txt
-
Upload the FREENAS-MIB.txt file to the Zabbix Docker server in the following directory:
/opt/zabbix-docker/zbx_env/var/lib/zabbix/mibs
-
Restart the Zabbix docker stack:
cd /opt/zabbix-docker && docker-compose down
cd /opt/zabbix-docker && docker-compose up -d
-
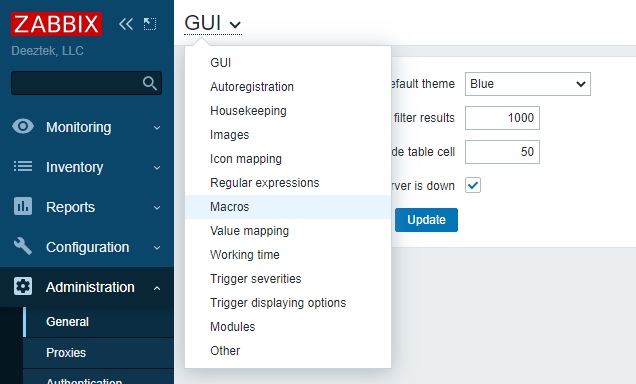
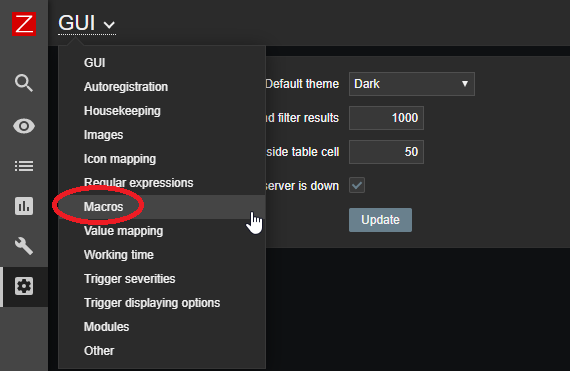
On the Zabbix server navigate to Administration --> General --> GUI drop-down --> Macros (Figure 10)
Figure 10
-
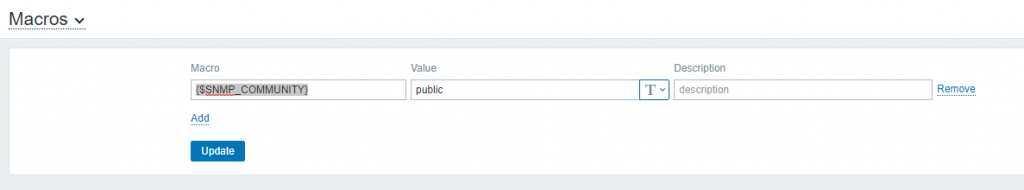
Ensure the Value field of the {$SNMP_COMMUNITY} Macro is set to public or whatever value you set the FreeNAS Community string from above and click the Update button (Figure 11).
Figure 11
-
Using a web browser download the following templates from Zabbix Share:
SNMP Intefaces discovery
SNMP Interfaces discovery
SNMP Generic
FreeNAS 11 SNMP
-
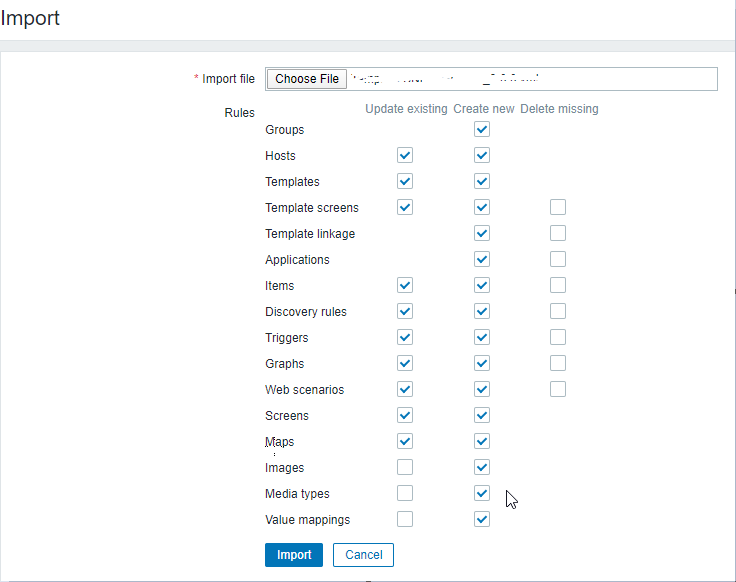
On the Zabbix server navigate to Configuration --> Templates --> Import and import each of the templates you downloaded above ensuring the Rules are set like below before each import (Figure 12):
Figure 12
-
On the Zabbix server navigate to Configuration --> Hosts --> Create Host
-
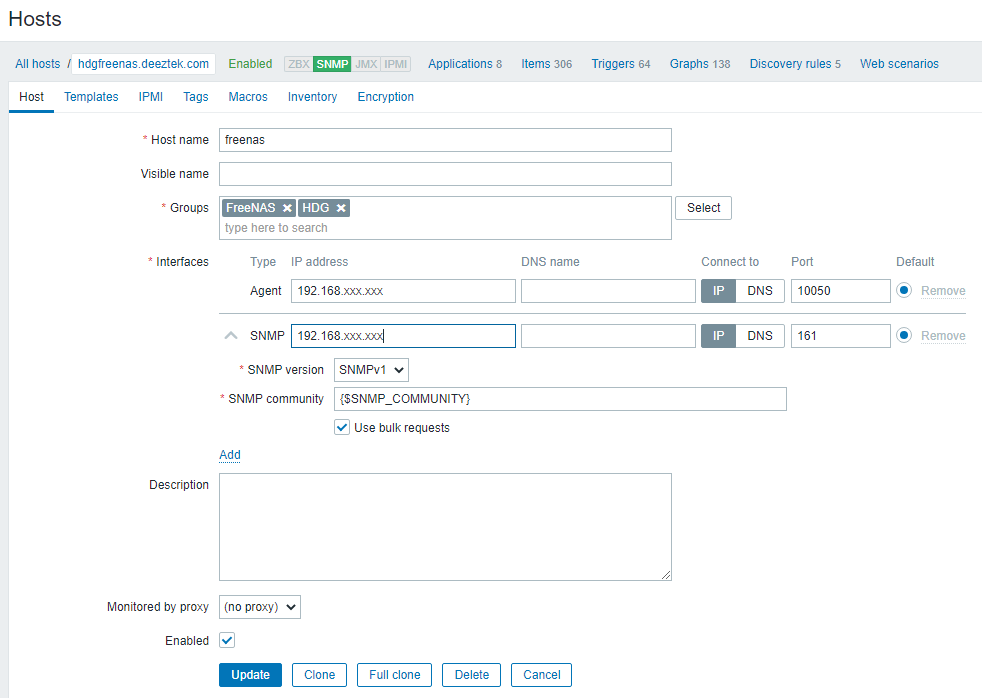
In the Host tab, fill out the Host name, groups and interfaces where 192.168.xxx.xxx is the IP of your FreeNAS host (Figure 13)
Figure 13
-
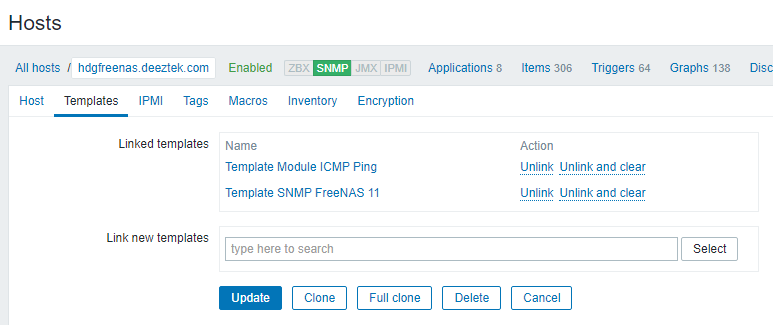
In the Templates tab, ensure you link the Template Module ICMP Ping and the Template SNMP FREENAS 11 templates and click the Update button (Figure 14)
Figure 14
-
Wait 10-15 minutes before Zabbix starts pulling data from the FreeNAS server. If successful, Monitoring --> Hosts should show the FreeNAS server listed with SNMP turned green (Figure 15)
Figure 15

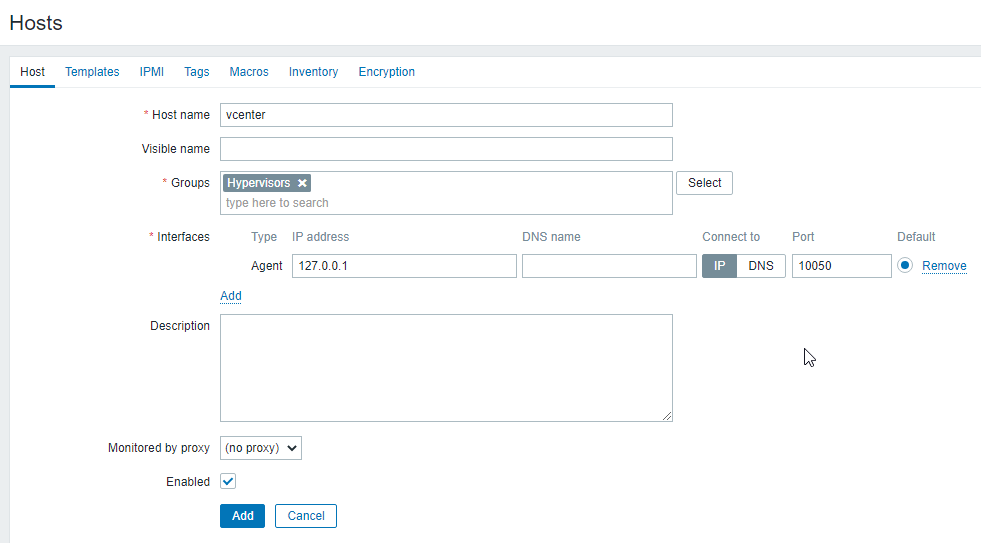
Enable Zabbix VMware Monitoring
Original Guide URL:
https://bestmonitoringtools.com/vmware-monitoring-with-zabbix-esxi-vcenter-vm-vsphere/
-
Enable (Remove the # from front of each line) on the following entries in /opt/zabbix-docker/.env_srv and save the file:
ZBX_STARTVMWARECOLLECTORS=3
ZBX_VMWAREFREQUENCY=60
ZBX_VMWAREPERFFREQUENCY=60
ZBX_VMWARECACHESIZE=128M
ZBX_VMWARETIMEOUT=120
Restart the Zabbix docker stack:
cd /opt/zabbix-docker && docker-compose down
cd /opt/zabbix-docker && docker-compose up -d
Figure 16
-
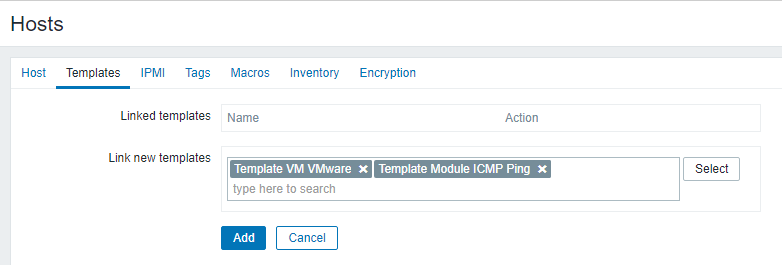
Click the Templates tab and select Template VM VMware and Template Module ICMP Ping templates (Figure 17)
Figure 17
-
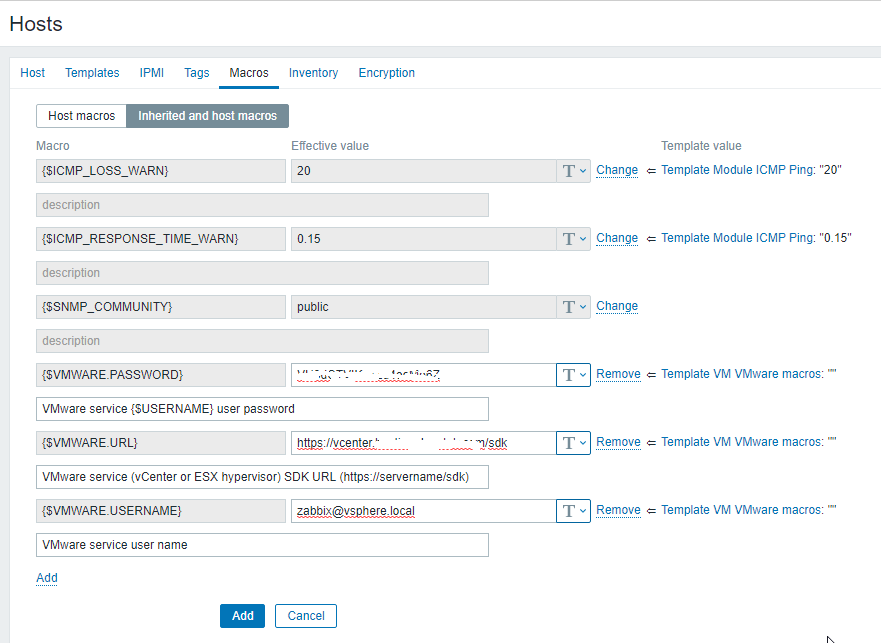
Click the Macros tab and then click Inherited and host macros button.
-
Click the Change link next to each of the following fields and fill out the value of each field with the Password, URL (https://vcenter/sdk) and Username of your Vcenter/VMware server and click the Add button (Figure 18):
{$VMWARE.PASSWORD}
{$VMWARE.URL}
{$VMWARE.USERNAME}
Figure 18
-
VMware/Vcenter discovery can take hours to complete.
-
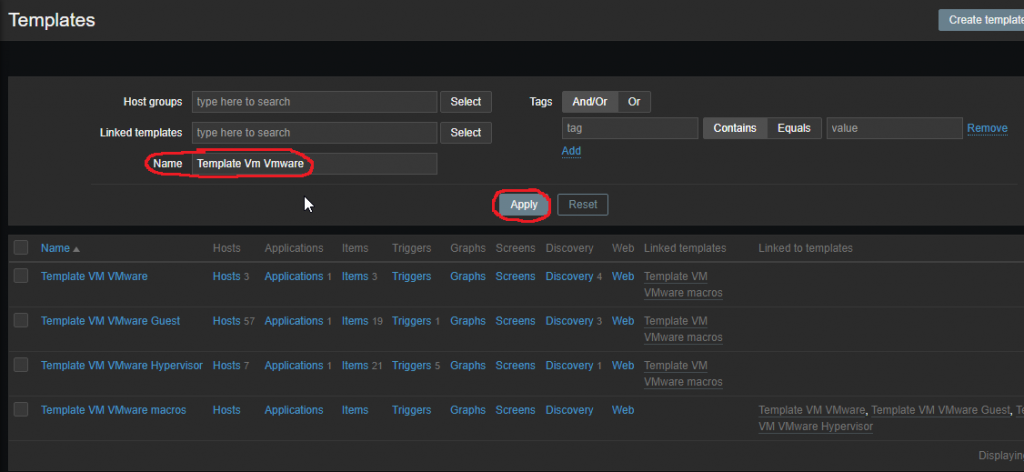
Navigate to Configuration --> Templates. In the Name field enter Template Vm Vmware and click the Apply button to locate the Template Vm Vmware template (Figure 19):
Figure 19
-
On the Template Vm Vmware entry click on the Discovery link (Figure 20):
Figure 20

-
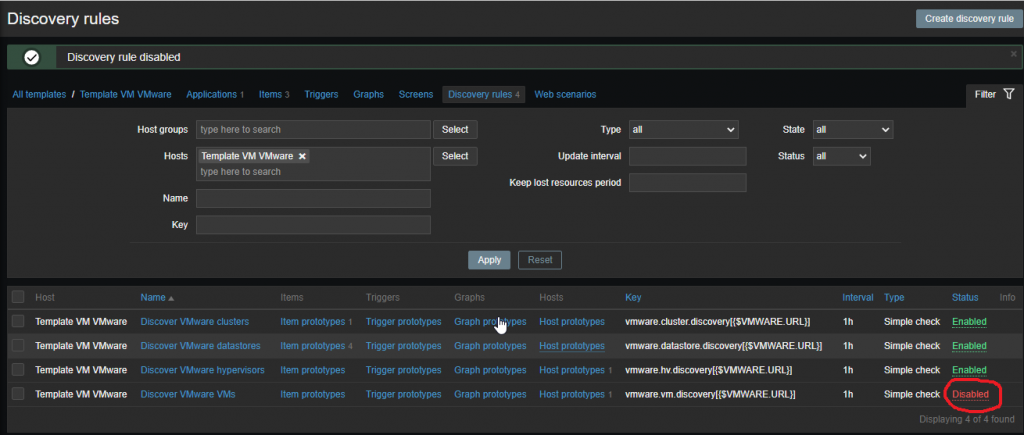
On the Discovery rules screen, click on the Enabled link on the Discover Vmware VMs entry to change the status to Disabled (Figure 21):
Figure 21
-
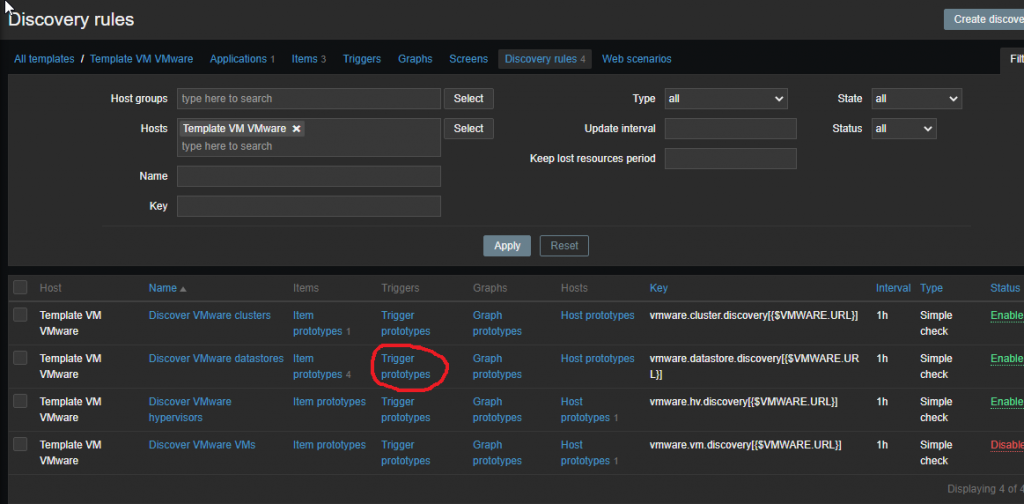
Next, click on the Trigger prototypes on the Discover VMware datastores entry (Figure 22):
Figure 22
-
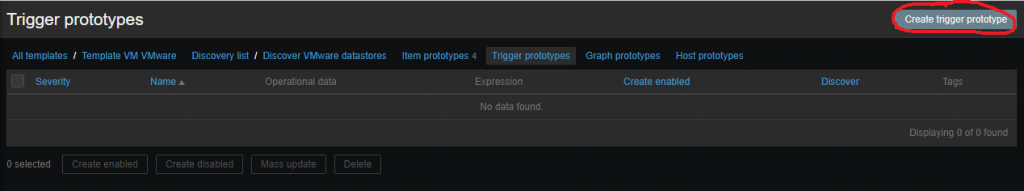
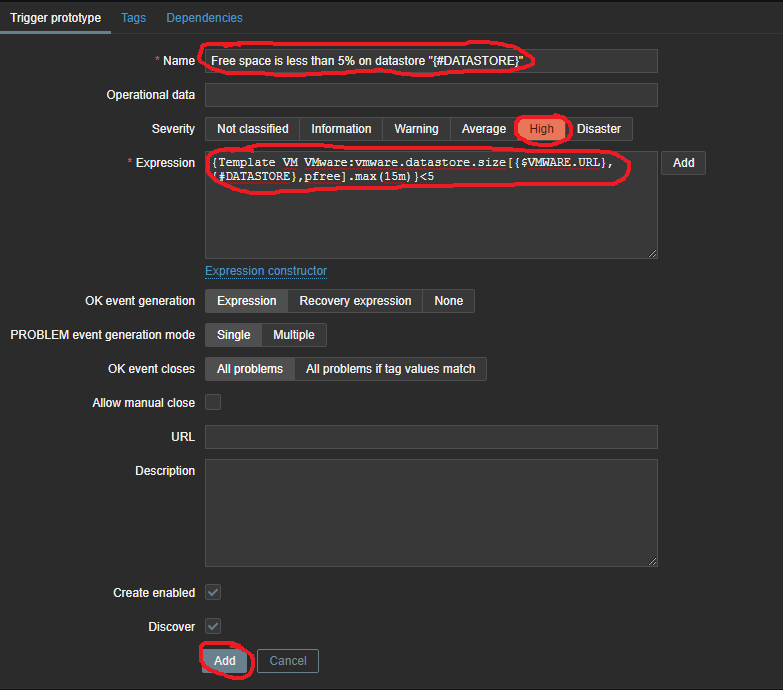
On the Trigger prototypes screen, click the Create trigger prototype button (Figure 23):
Figure 23
-
On the Trigger prototype screen, in the Name field enter the following:
Free space is less than 5% on datastore "{#DATASTORE}"
-
In the Severity field set it to High
-
In the Expression field enter the following:
{Template VM VMware:vmware.datastore.size[{$VMWARE.URL},{#DATASTORE},pfree].max(15m)}<5
Figure 24
Install Zabbix Agent Ubuntu
Ubuntu 22.04
wget https://repo.zabbix.com/zabbix/5.0/ubuntu/pool/main/z/zabbix-release/zabbix-release_5.0-2+ubuntu22.04_all.debdpkg -i zabbix-release_5.0-2+ubuntu22.04_all.debapt-get updateapt-get install zabbix-agentUbuntu 20.04
wget https://repo.zabbix.com/zabbix/5.0/ubuntu/pool/main/z/zabbix-release/zabbix-release_5.0-1%2Bfocal_all.debdpkg -i zabbix-release_5.0-1+focal_all.debapt-get updateapt-get install zabbix-agentUbuntu 18.04
wget https://repo.zabbix.com/zabbix/5.0/ubuntu/pool/main/z/zabbix-release/zabbix-release_5.0-1%2Bbionic_all.debdpkg -i zabbix-release_5.0-1+bionic_all.debsudo apt updateapt-get install zabbix-agentConfigure Zabbix Agent for Passive Checks
Edit the zabbix configuration file:
sudo vi /etc/zabbix/zabbix_agentd.confSet the following parameter according to your environment:
Server=192.168.100.51save the file and close
Restart and enable zabbix agent service
sudo systemctl restart zabbix-agentsudo systemctl enable zabbix-agentStart/stop/check status of zabbix agent service:
sudo systemctl start zabbix-agent
sudo systemctl stop zabbix-agent
sudo systemctl status zabbix-agentConfigure Zabbix Agent for Active Checks
Edit the zabbix configuration file:
sudo vi /etc/zabbix/zabbix_agentd.confSet the following parameters according to your environment:
ServerActive=192.168.100.51
Hostname=zabbix.fosstechnix.localsave the file and close
Restart and enable zabbix agent service
sudo systemctl restart zabbix-agentsudo systemctl enable zabbix-agentStart/stop/check status of zabbix agent service:
sudo systemctl start zabbix-agent
sudo systemctl stop zabbix-agent
sudo systemctl status zabbix-agentConfigure TLS with PSK
Edit the zabbix configuration file:
sudo nano /etc/zabbix/zabbix_agentd.confSet the following parameters where unique_psk_identity is some unique value for the agent you are configuring. I can be anything as long as it's unique for this host:
TLSConnect=psk
TLSAccept=psk
TLSPSKIdentity=unique_psk_identity
TLSPSKFile=/etc/zabbix/zabbix_agentd.psksave the file and close
Run the following command to generate a psk file using the path and name specified in the TLSPSKFile parameter from above:
openssl rand -hex 32 | sudo tee /etc/zabbix/zabbix_agentd.pskNote the generated random string as you will need it to configure the agent on the Zabbix server under the Configuration --> Hosts --> Host -->Encryption tab.
Start/stop/check status of zabbix agent service:
sudo systemctl start zabbix-agent
sudo systemctl stop zabbix-agent
sudo systemctl status zabbix-agentZammad Monitoring with Zabbix
Zammad Configuration
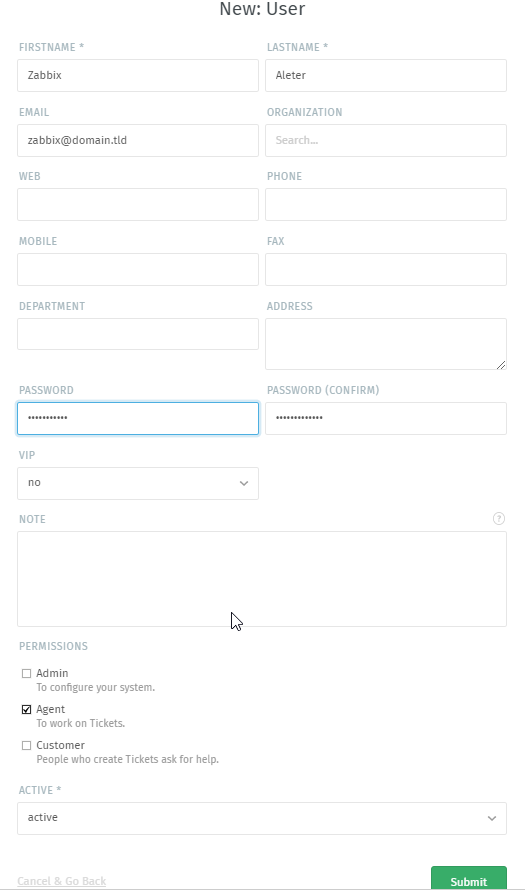
Click on Settings --> Users --> New User and create a new user for Zabbix by filling out FIRSTNAME, LASTNAME, EMAIL, PASSWORD and setting the PERMISSIONS to Agent (Figure 1):
Figure 1
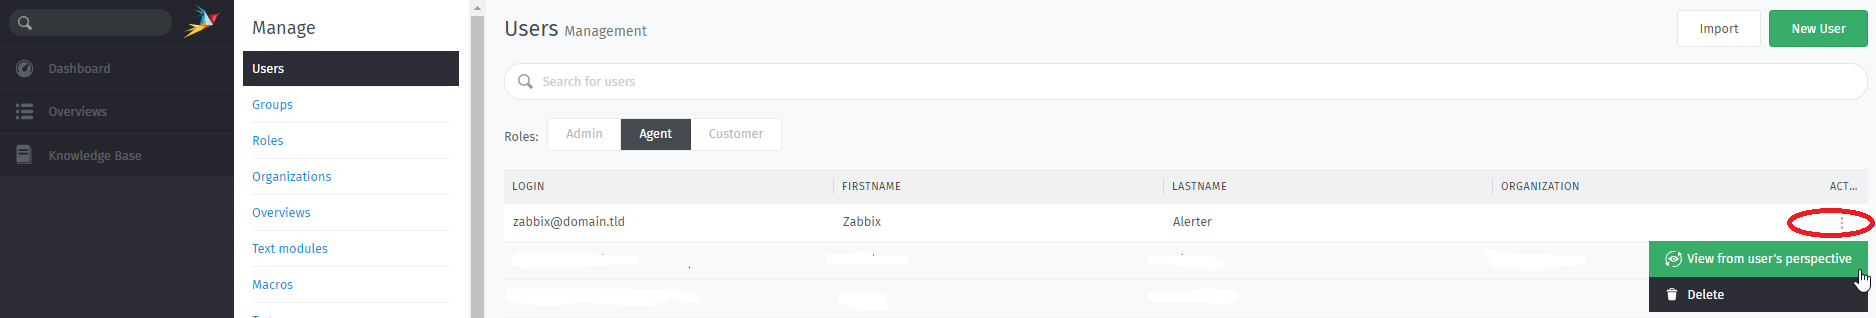
Once the user is created, locate the user, click the 3 dots under ACTIONS column and click on View from user's perspective option from the corresponding menu (Figure 2):
Figure 2
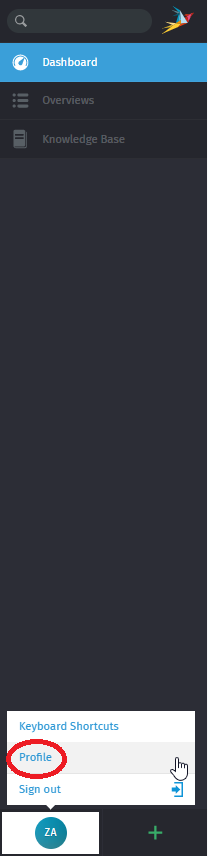
Click the user's initials on the bottom left of the screen and click on the Profile option from the corresponding menu (Figure 3):
Figure 3
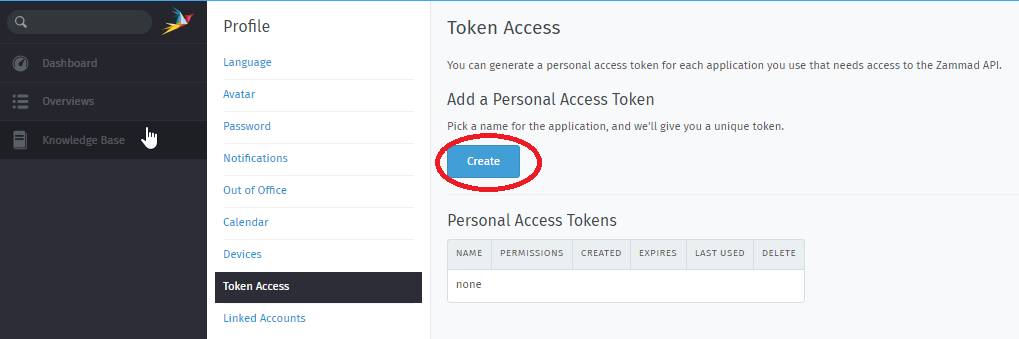
Under the Profile section, click Token Access --> Create (Figure 4):
Figure 4
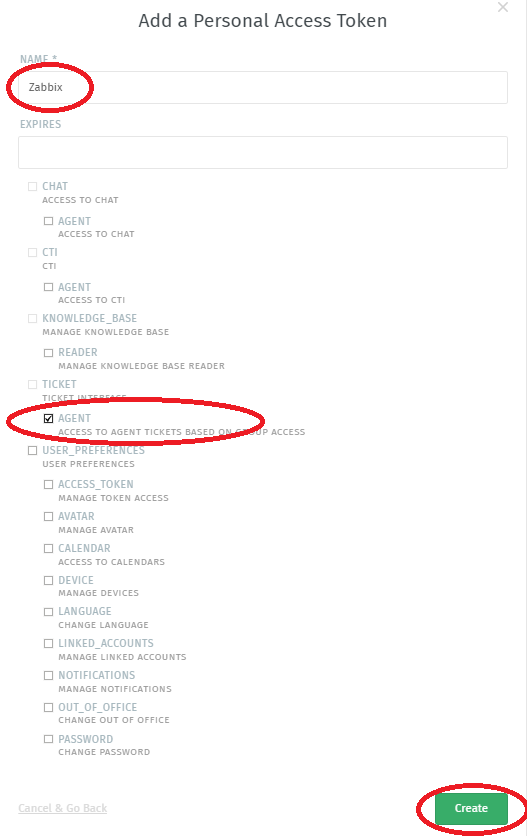
In the Add a Personal Access Token window, in the name field enter Zabbix, check AGENT under TICKET and click the Create button (Figure 5):
Figure 5
On the resulting Your New Personal Access Token window, ensure you copy the token and click the OK, I've copied my token button (Figure 6):
Figure 6

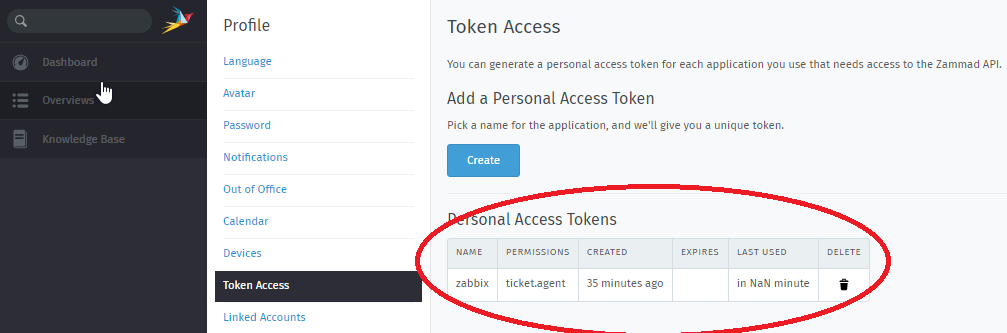
In the Token Access page, under the Personal Access Tokens you should see the following entry (Figure 7):
Figure 7
Zabbix Configuration
Click on Administration --> General -->GUI --> Macros (Figure 8):
Figure 8
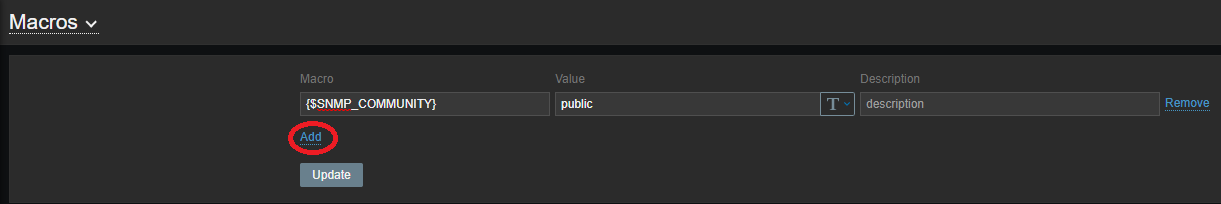
Under the Macros page, click on the Add link to add a new Macro (Figure 9):
Figure 9
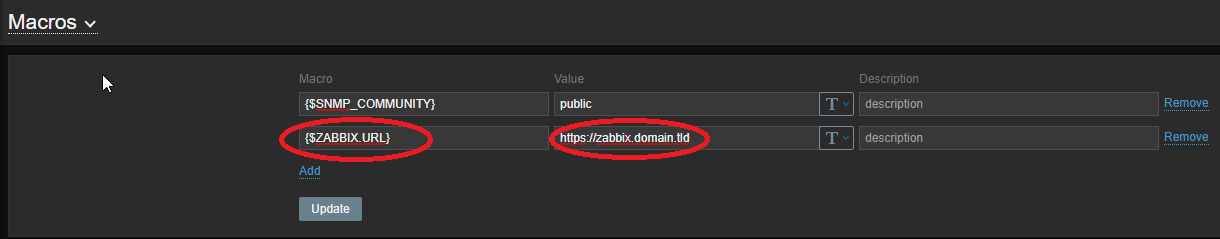
In the new Macro entry enter {$ZABBIX.URL} in the Macro field, enter the URL to the Zabbix serverand in the Value field and click the Update button below (Figure 10):
Figure 10
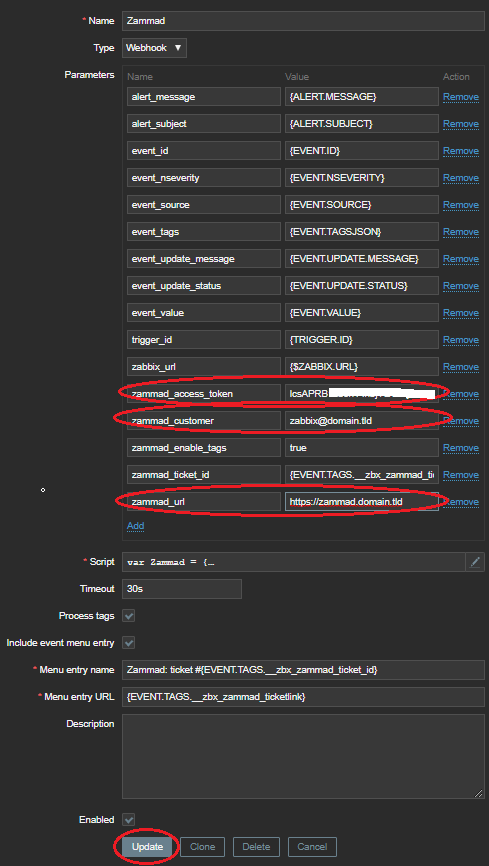
Click on Administration --> Media Types --> Zammad. In the zammad_access_token field enter the Personal Access Token you created earlier the Zammad, in the zammad_url field enter the the URL to your Zammad installation, in the zammad_customer field enter the e-mail address of the Zammad user you created earlier and click the Update button (Figure 11):
Figure 11
Click on Administration --> Users --> Zabbix-User (where Zabbix-User is a user already created in Zabbix). Once in the User page, click on Media and then click the Add button (Figure 12):
Figure 12

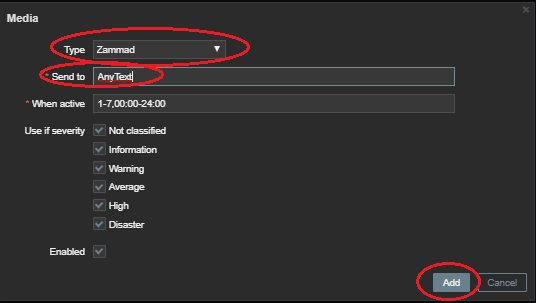
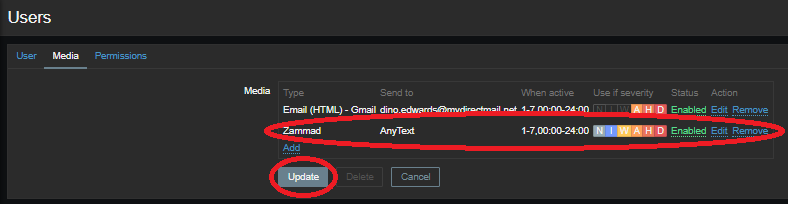
In the Media window, in the Type field, select Zammad, in the Send to field enter AnyText (this field is not used but it's required to be filled in) and click the Add button (Figure 13):
Figure 13
Back in Users --> Media , you should see the newly added Zammad media type. Ensure you click the Update button to save your changes (Figure 14):
Figure 14
Docker Container Monitoring With Zabbix
Credit Dmitry Lambert Original URL: https://blog.zabbix.com/docker-container-monitoring-with-zabbix/20175/
Importing the official Docker template
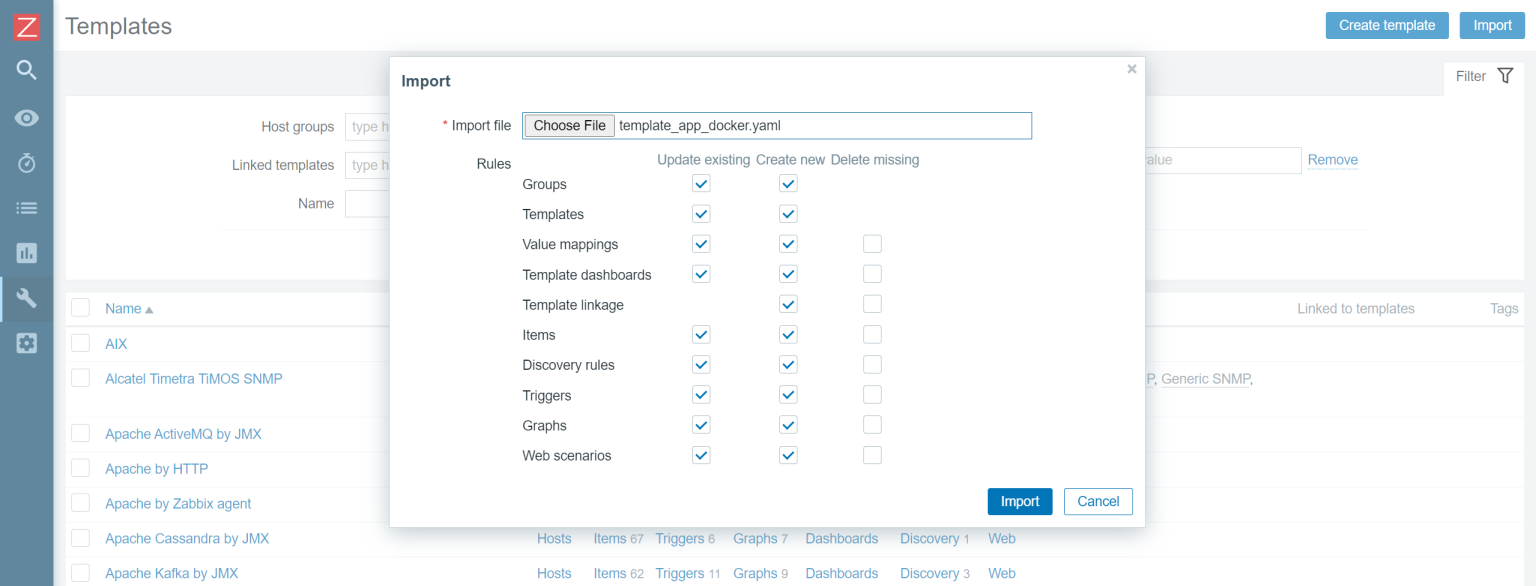
Since we will be using the official Docker by Zabbix agent 2 template, first, we need to make sure that the template is actually available in our Zabbix instance. The template is available for Zabbix versions 5.0, 5.4, and 6.0. If you cannot find this template under Configuration – Templates, chances are that you haven’t imported it into your environment after upgrading Zabbix to one of the aforementioned versions. Remember that Zabbix does not modify or import any templates during the upgrade process, so we will have to import the template manually. If that is so, simply download the template and import it into your Zabbix instance by using the Import button in the Configuration – Templates section.
Installing and configuring Zabbix agent 2
Before we get started with configuring our host, we first have to install Zabbix agent 2 and configure it according to the template guidelines. Follow the steps in the download section of the Zabbix website and install the zabbix-agent2 package. Feel free to use any other agent deployment methods if you want to (like compiling the agent from the source files).
Plugin specific Zabbix agent 2 configuration
Zabbix agent 2 provides plugin-specific configuration parameters. Mostly these are optional parameters related to a specific plugin. You can find the full list of plugin-specific configuration parameters in the Zabbix documentation. In the newer versions of Zabbix agent 2, the plugin-specific parameters are defined in separate plugin configuration files, located in /etc/zabbix/zabbix_agent2.d/plugins.d/, while in older versions, they are defined directly in the zabbix_agent2.conf file.
Before we move on to Zabbix frontend, I would like to point your attention to the Docker socket file permission – the zabbix user needs to have access to the Docker socket file. The zabbix user should be added to the docker group to resolve the following error messages.
[Docker] cannot fetch data: Get http://1.28/info: dial unix /var/run/docker.sock: connect: permission deniedZBX_NOTSUPPORTED: Cannot fetch data.You can add the zabbix user to the Docker group by executing the following command:
usermod -aG docker zabbixConfiguring the docker host
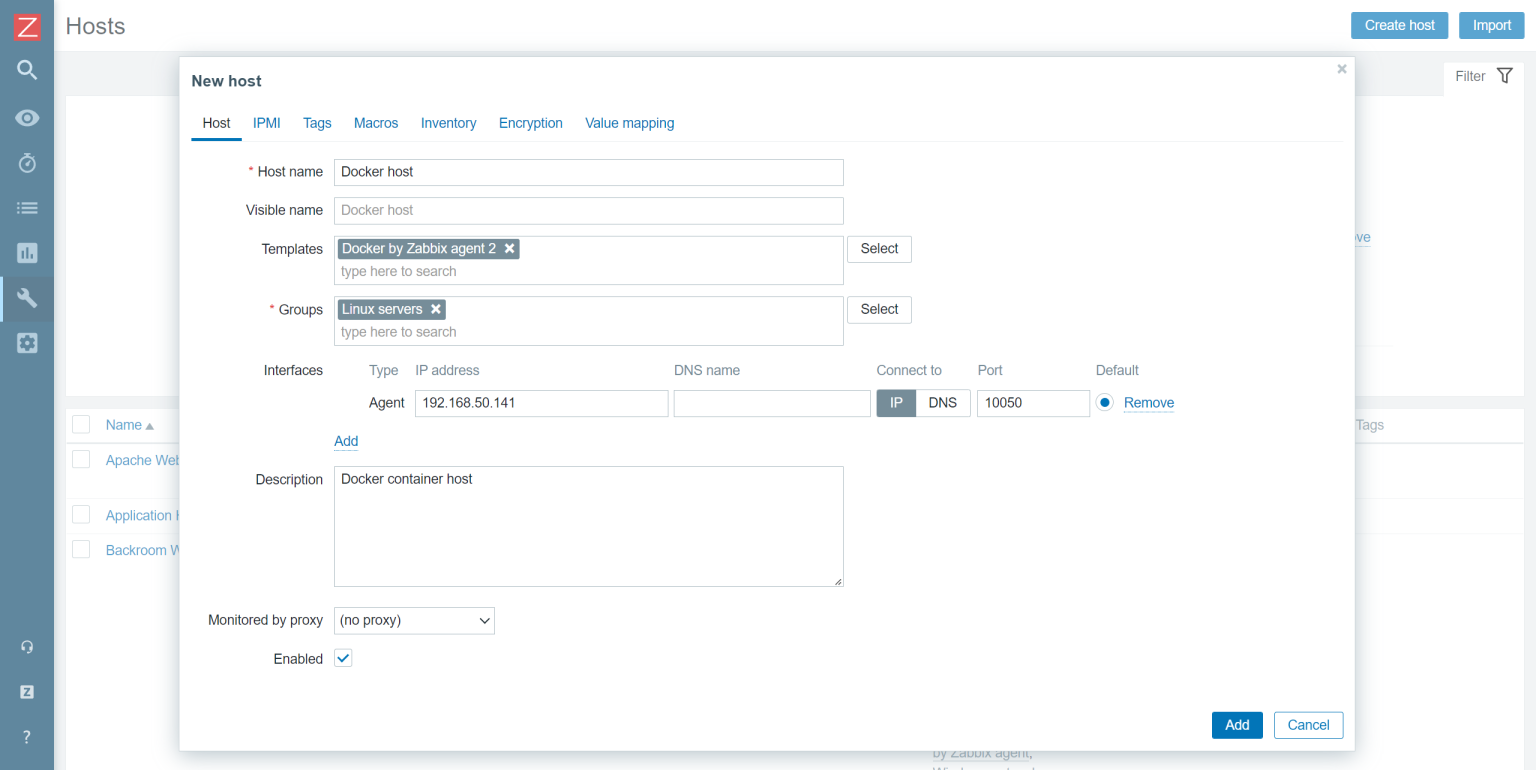
After importing the template, we have to create a host which will represent our Docker instance. Give the host a name and assign it to a Host group – I will assign it to the Linux servers host group. Assign the Docker by Zabbix agent 2 template to the host. Since the template uses Zabbix agent 2 to collect the metrics, we also have to add an agent interface on this host. The address of the interface should point to the machine running your Docker containers. Finish up the host configuration by clicking the Add button.
Docker by Zabbix agent 2 template
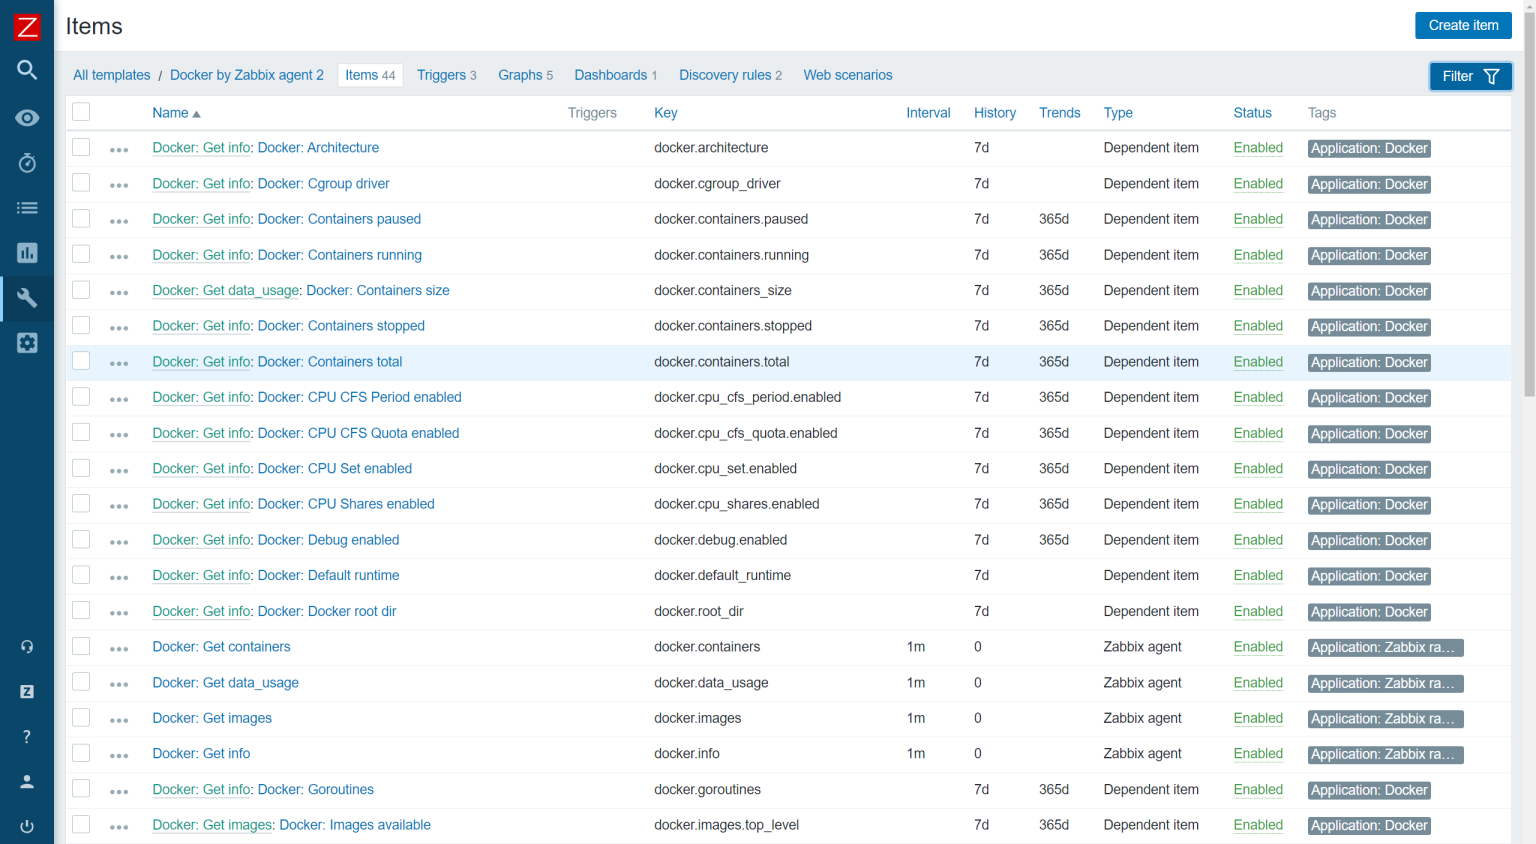
The template contains a set of regular items for the general Docker instance metrics, such as the number of available images, Docker architecture information, the total number of containers, and more.
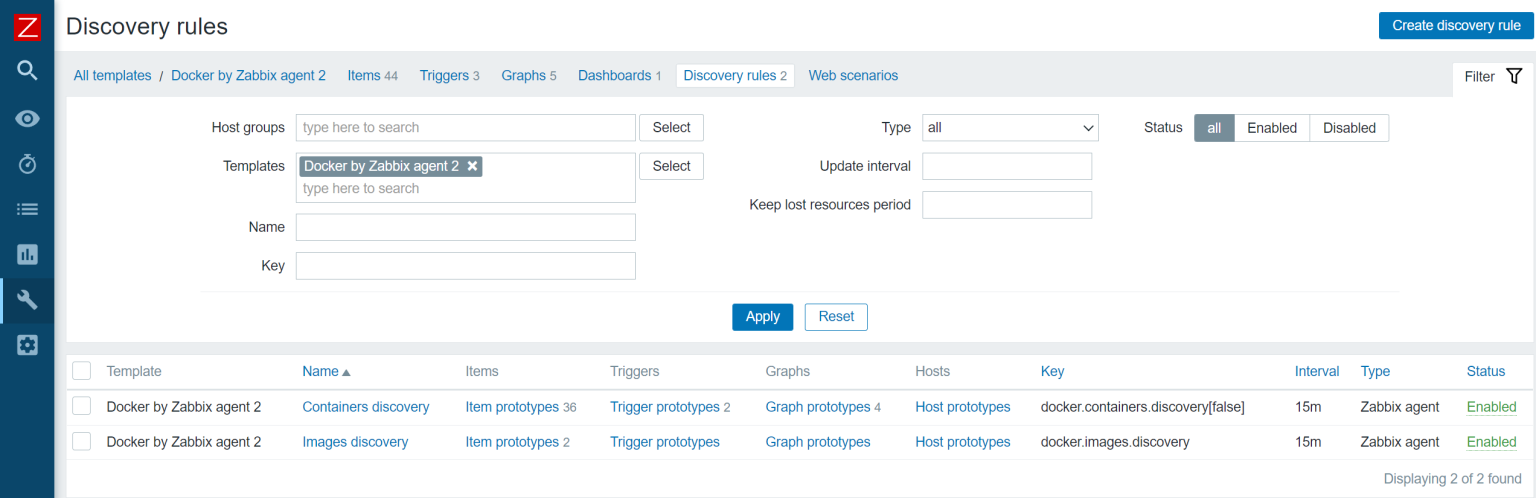
On top of that, the template also gathers container and image-specific information by using low-level discovery rules.
Once Zabbix discovers your containers and images, these low-level discovery rules will then be used to create items, triggers, and graphs from prototypes for each of your containers and images. This way, we can monitor container or image-specific metrics, such as container memory, network information, container status, and more.

Verifying the host and template configuration
To verify that the agent and the host are configured correctly, we can use Zabbix get command-line tool and try to poll our agent. If you haven’t installed Zabbix get, do so on your Zabbix server or Zabbix proxy host:
dnf install zabbix-getNow we can use zabbix-get to verify that our agent can obtain the Docker-related metrics. Execute the following command:
zabbix_get -s docker-host -k docker.infoUse the -s parameter to specify your agent host’s host name or IP address. The -k parameter specifies the item key for which we wish to obtain the metrics by polling the agent with Zabbix get.
zabbix_get -s 192.168.50.141 -k docker.info
{"Id":"SJYT:SATE:7XZE:7GEC:XFUD:KZO5:NYFI:L7M5:4RGO:P2KX:QJFD:TAVY","Containers":2,"ContainersRunning":2,"ContainersPaused":0,"ContainersStopped":0,"Images":2,"Driver":"overlay2","MemoryLimit":true,"SwapLimit":true,"KernelMemory":true,"KernelMemoryTCP":true,"CpuCfsPeriod":true,"CpuCfsQuota":true,"CPUShares":true,"CPUSet":true,"PidsLimit":true,"IPv4Forwarding":true,"BridgeNfIptables":true,"BridgeNfIP6tables":true,"Debug":false,"NFd":39,"OomKillDisable":true,"NGoroutines":43,"LoggingDriver":"json-file","CgroupDriver":"cgroupfs","NEventsListener":0,"KernelVersion":"5.4.17-2136.300.7.el8uek.x86_64","OperatingSystem":"Oracle Linux Server 8.5","OSVersion":"8.5","OSType":"linux","Architecture":"x86_64","IndexServerAddress":"https://index.docker.io/v1/","NCPU":1,"MemTotal":1776848896,"DockerRootDir":"/var/lib/docker","Name":"localhost.localdomain","ExperimentalBuild":false,"ServerVersion":"20.10.14","ClusterStore":"","ClusterAdvertise":"","DefaultRuntime":"runc","LiveRestoreEnabled":false,"InitBinary":"docker-init","SecurityOptions":["name=seccomp,profile=default"],"Warnings":null}In addition, we can also use the low-level discovery key – docker.containers.discovery[false] to check the result of the low-level discovery.
zabbix_get -s 192.168.50.141 -k docker.containers.discovery[false]
[{"{#ID}":"a1ad32f5ee680937806bba62a1aa37909a8a6663d8d3268db01edb1ac66a49e2","{#NAME}":"/apache-server"},{"{#ID}":"120d59f3c8b416aaeeba50378dee7ae1eb89cb7ffc6cc75afdfedb9bc8cae12e","{#NAME}":"/mysql-server"}]We can see that Zabbix will discover and start monitoring two containers – apache-server and mysql-server. Any agent low-level discovery rule or item can be checked with Zabbix get.
Docker template in action
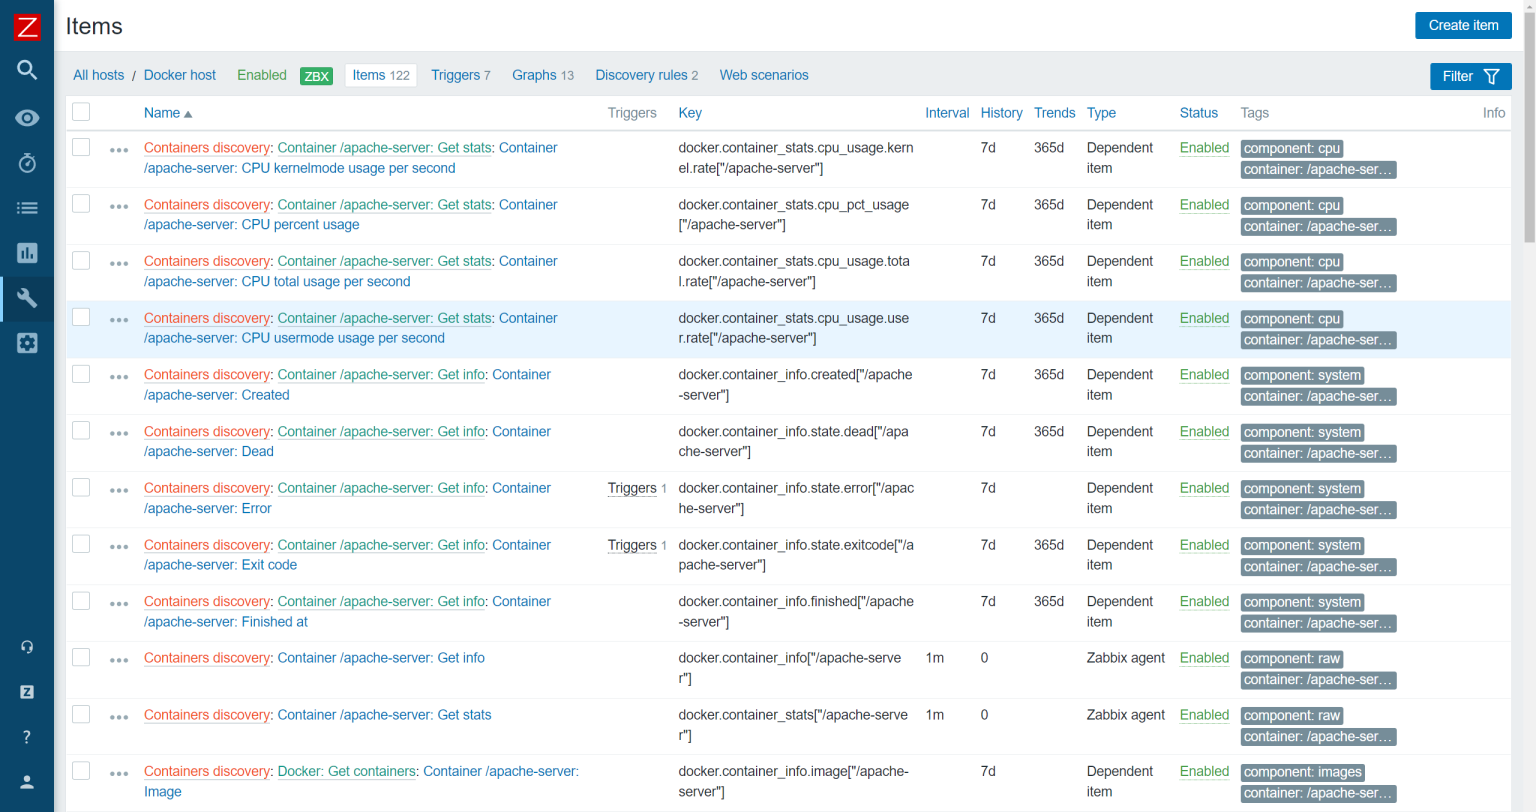
Now that we have configured our agent and host, applied the Docker template, and verified that everything is working, we should be able to see the discovered entities in the frontend.

In addition, our metrics should have also started coming in. We can check the Latest data section and verify that they are indeed getting collected.
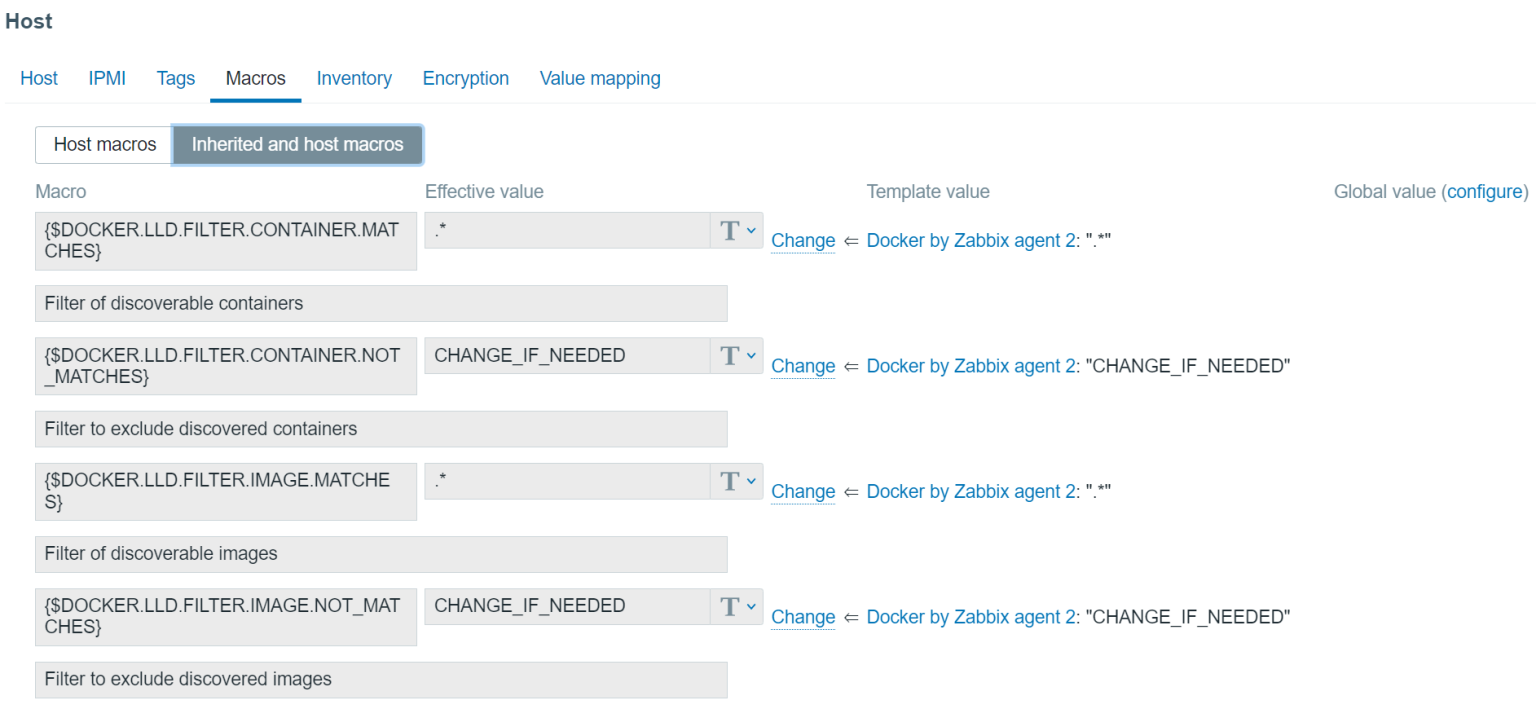
Lastly, we have a few additional options for further modifying the template and the results of our low-level discovery. If you open the Macros section of your host and select Inherited and host macros, you will notice that there are 4 macros inherited from the Docker template. These macros are responsible for filtering in/out the discovered containers and images. Feel free to modify these values if you wish to filter in/out the discovery of these entities as per your requirements.
Notice that the container discovery item also has one parameter, which is defined as false on the template:
- docker.containers.discovery[false] – Discover only running containers
- docker.containers.discovery[true] – Discover all containers, no matter their state.
Truenas Monitoring with Zabbix
Enable SNMP on Truenas Host
- On your Truenas host navigate to Services.
- Locate the SNMP service and click the
 icon (Figure 1).
Figure 1
- Take note of the Community value which by default should be set to public (Figure 2) and click the CANCEL button to go back to Services.
Figure 2
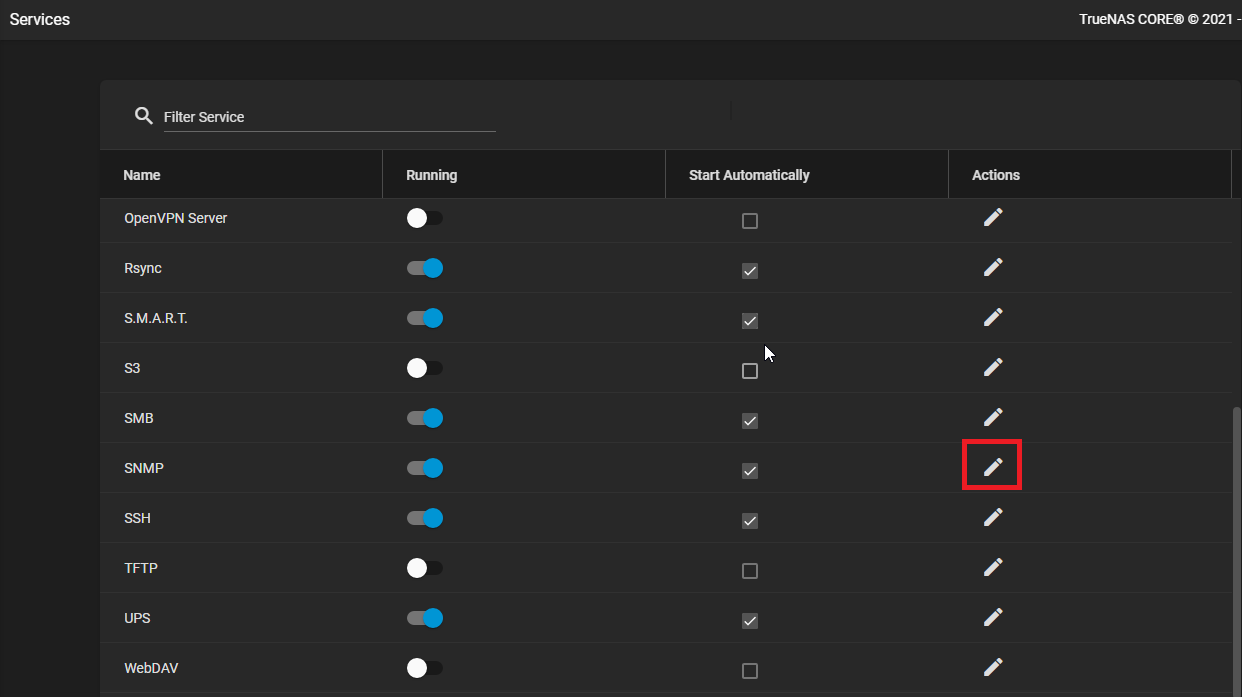
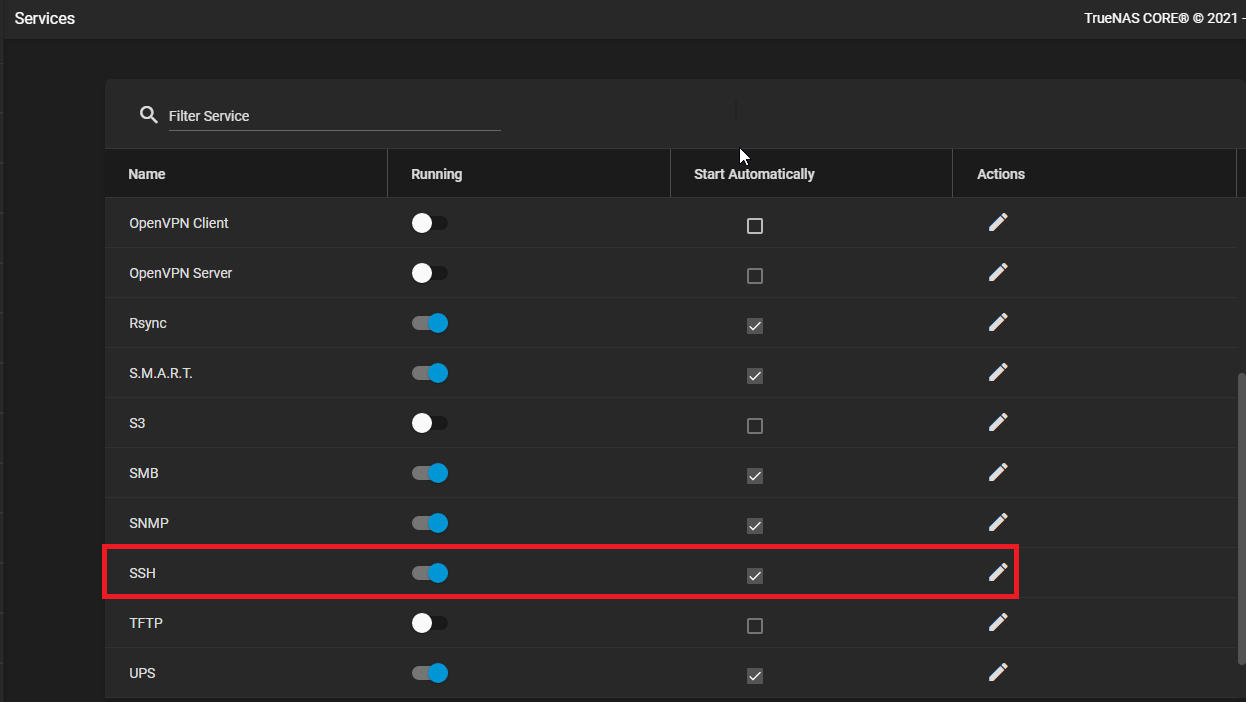
- Back in the Services page, on the SNMP service, ensure the Start Automatically is checked and slide the Running slider to the right so that it turns blue to indicate the service is running (Figure 3).
Figure 3
Download the the FREENAS-MIB Definitions File from your Truenas Host
- On your Truenas host navigate to Services.
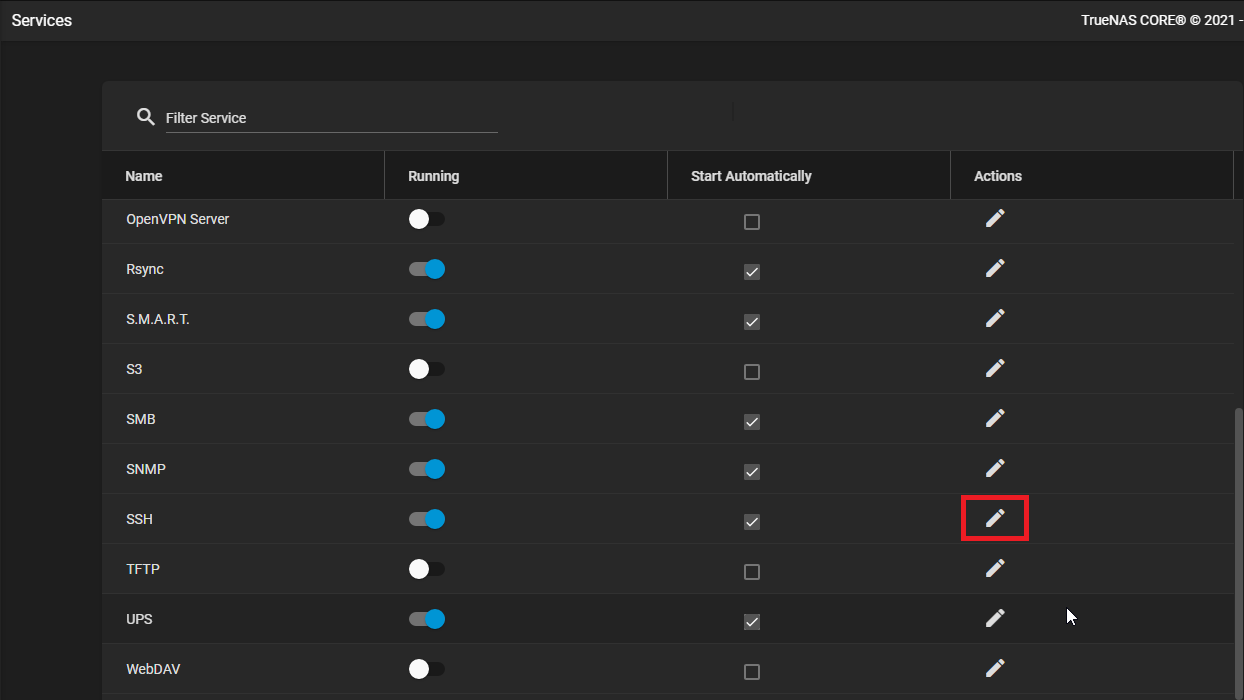
- Locate the SSH service and click the icon (Figure 4).
Figure 4
- Place a checkmark on the Log in as Root with Password checkbox and click the SAVE button (Figure 5).
Figure 5
- Back in the Services page, on the SSH service, ensure the Start Automatically is checked and slide the Running slider to the left to stop the SSH service and then slide back to the right so that it turns blue to indicate the service is running (this ensures the new SSH settings we set take effect (Figure 6).
Figure 6
- Using Winscp or any tool of your choice, login to your Truenas host using the SCP protocol, navigate to /usr/local/share/snmp/mibs/ and download FREENAS-MIB.txt to your computer.
Copy the the FREENAS-MIB Definitions File to your Zabbix Server
- Using Winscp or any tool of your choice, login to your Zabbix Server host using the SCP protocol and copy the FREENAS-MIB.txt file you downloaded from your Truenas host above to the /var/lib/zabbix/mibs/ directory. If you have deployed Zabbix server on docker, the directory would be /path-to-zabbix-docker/zbx_env/var/lib/zabbix/mibs/.
- Restart your Zabbix server.
Import the SNMP Freenas 11 Template into Zabbix Server
- Download the template_freenas_11_snmp.xml template from this article or download it from the Zabbix Community Templates Github page.
- On your Zabbix server navigate to Configuration ---> Templates --> Import.
- On the Import page, click the Choose File button and navigate to the location of the downloaded template_freenas_11_snmp.xml file and click Open.
- Back to the Import page, click the Import button (Figure 7).
Figure 7

Add Truenas Host to Zabbix server
- On your Zabbix server navigate to Configuration ---> Host ---> Create Host.
- In the Host name field enter the name of your Truenas host
- Set the Groups field to a an existing group or create a new one.
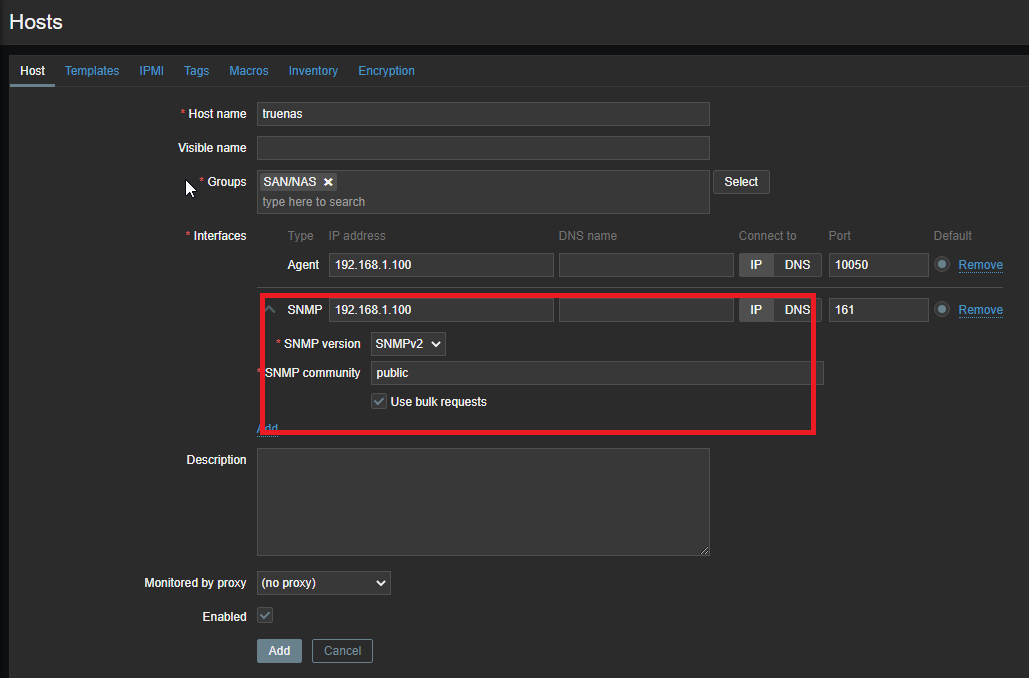
- In the Interfaces section add the IP address of your Truenas host in the Agent IP address field
- Click the Add link and in the resultant menu select the SNMP option (Figure 8).
Figure 8

- In the SNMP field enter the IP address of your Truenas host again.
- Ensure the SNMP version field is set to SNMPv2.
- In the SNMP community field enter the community value you got from the Truenas SNMP service above (Default: public) (Figure 9).
Figure 9
- Click the Templates link on top of the screen, in the Link new templates section, search and select the SNMP FreeNAS 11 template you imported earlier and then click the Update button (Figure 10).
Figure 10

Exclude Windows Services from Autodiscover in Zabbix 6.4
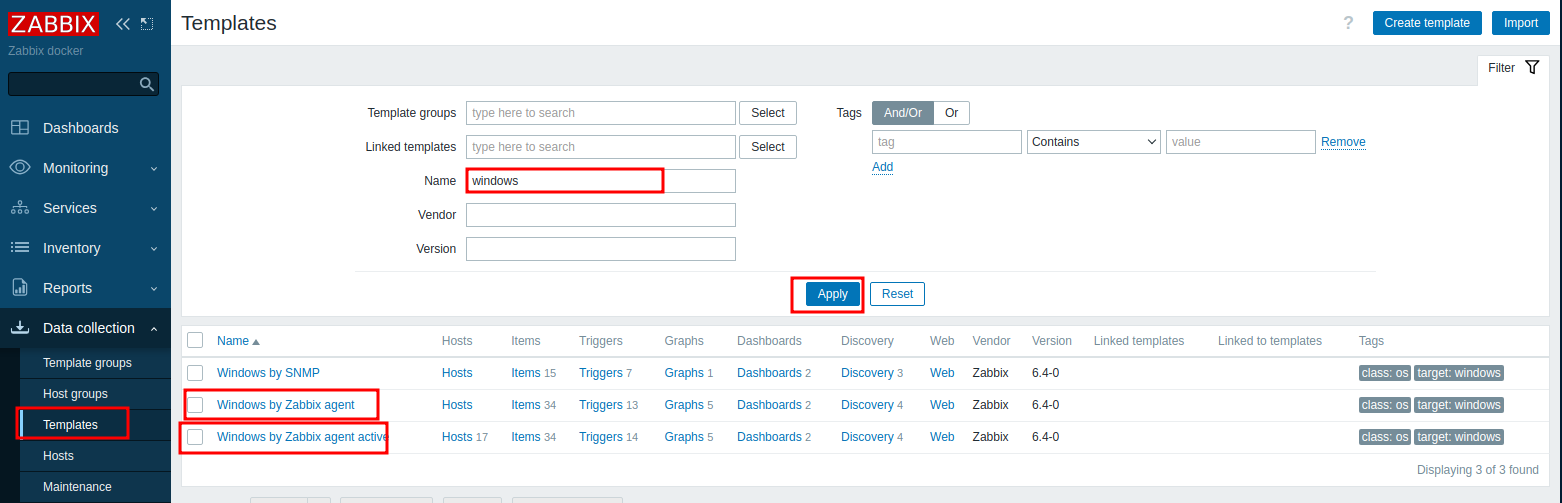
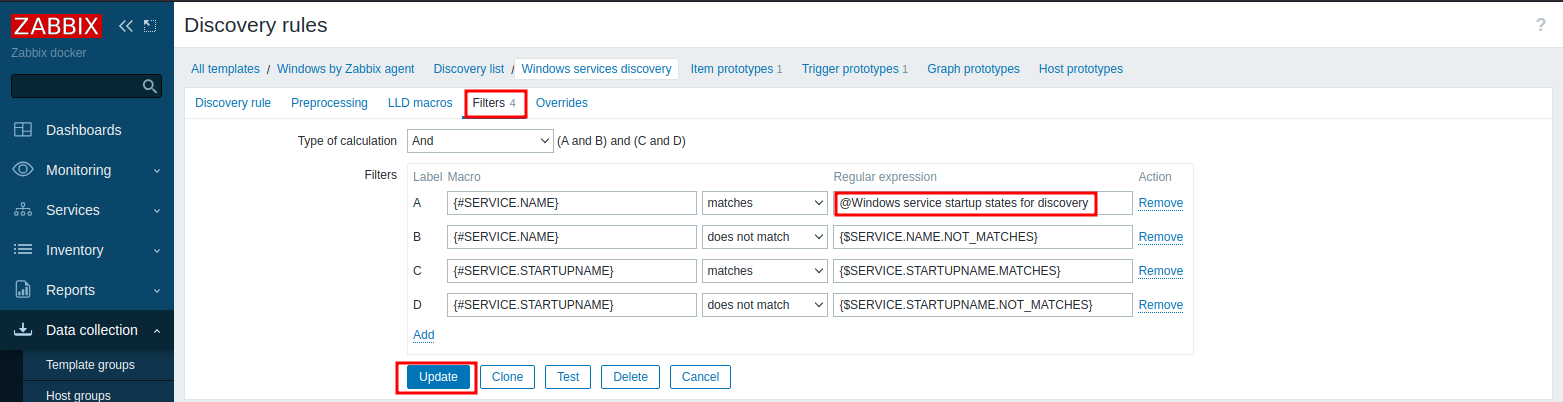
Next, click on Discovery rules tab and then click on Windows services discovery.
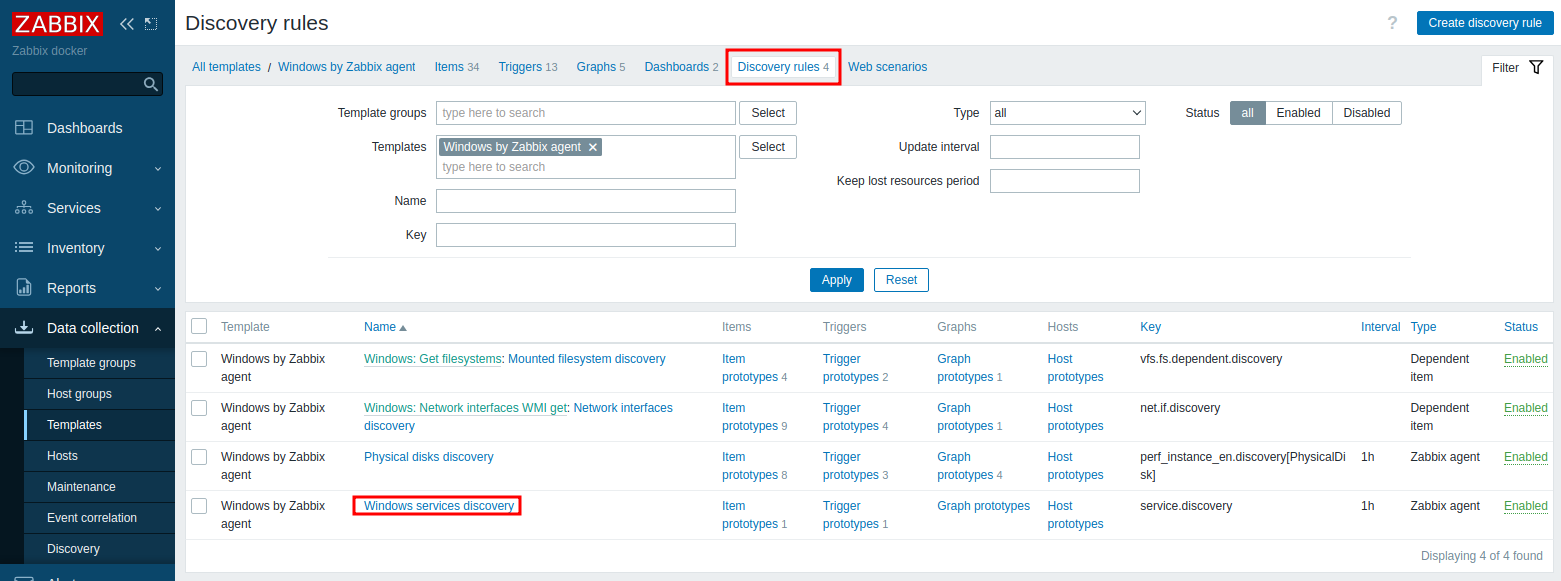
Next, click on Filters and then set the Label A Macro Regular expression field to @Windows service startup states for discovery and click the Update button.
Repeat the procedure above for the Windows by Zabbix Agent Active.
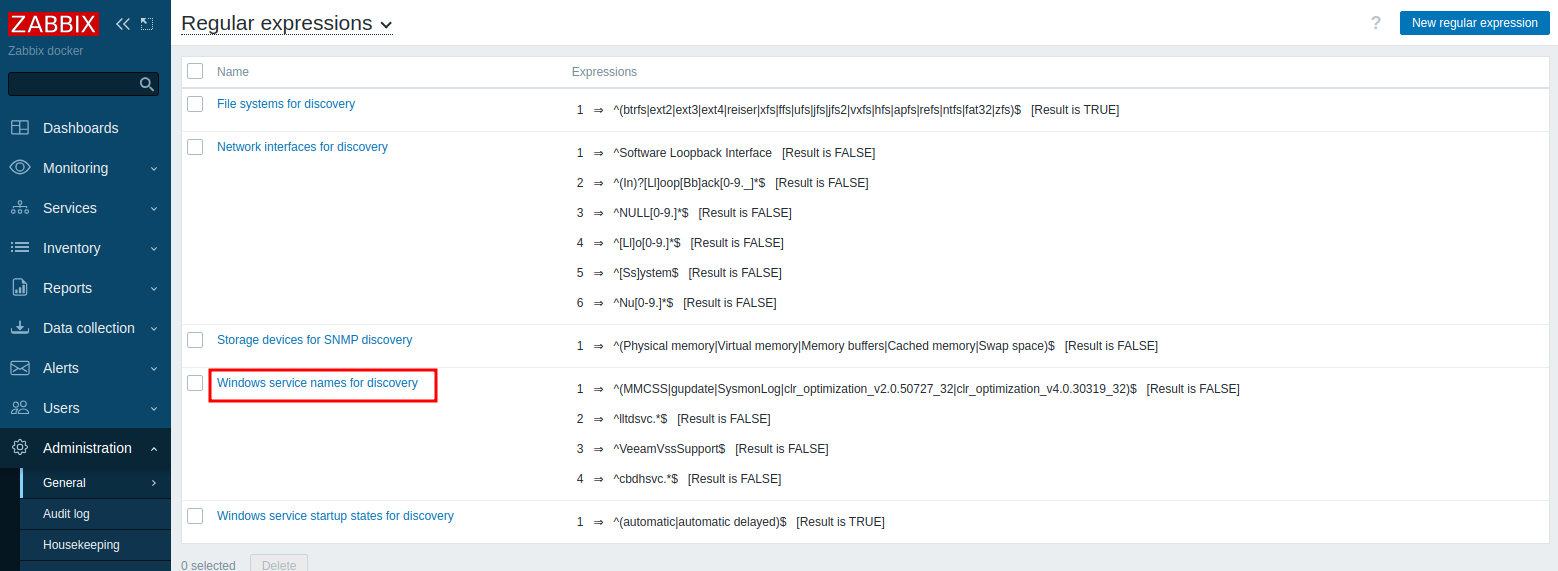
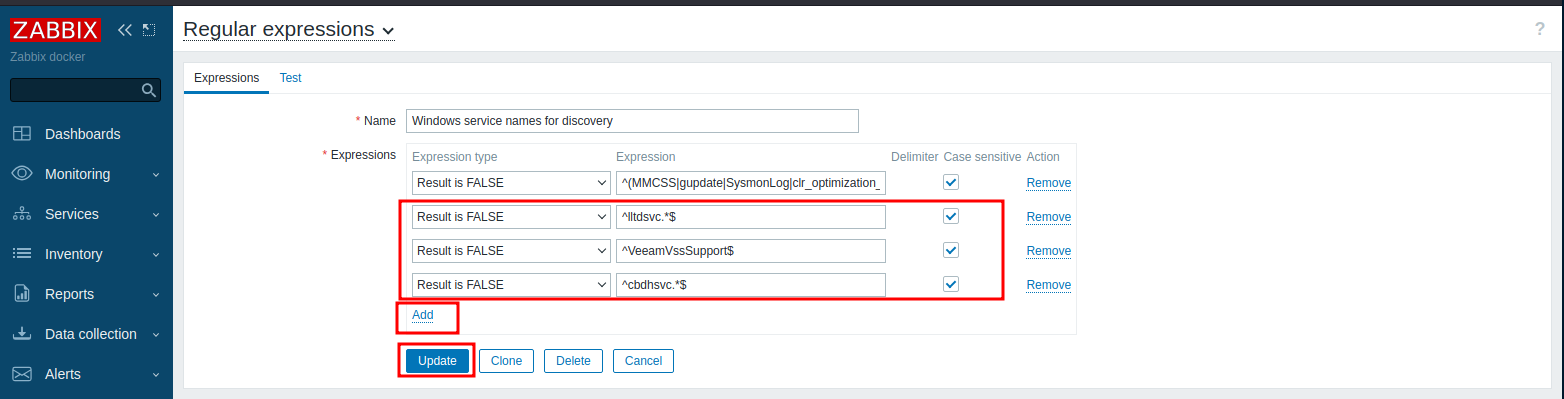
In the Regular Expressions page, click on Add, set the Expression type drop-down to Result is FALSE and in the expression field enter the service name you wish to exclude between a ^ and $ characters. (For example for the VeeamVssSupport service enter ^VeeamVssSupport$), check the Case sensitive box if necessary. Continue adding lines for each service you wish to exclude and click the Update button once finished. If you wish to use a wildcard expression for a service name, enter .* at the end of the service name. (Ex: ^ServiceName.*$).
Please note that if you exclude Windows services from Autodiscover AFTER the host has already been added to Zabbix, the service names will still show up as alarms in Zabbix. You must navigate to Data collection ---> Hosts, locate and click on the Host(s) in question, click on Unlink and clear next to the Windows by Zabbix agent template and click the Update button. Then, click on the Host(s) in question again and click on Delete and then re-add the Host(s) as necessary.